Copernicus NDVI seasonal variation as an indicator of biodiversity. Case of Study: Mayan Biosphere Guatemala, and it´s resistance to irregular rain period from October 2017 to May 2019.
Research based in a Praire experiment in Cedar Creek, Minnesota, USA. Copernicus Soil Water Index as a compliment to measure water stress affecting canopy growing.
Author: Fernando Roque. Email: fmroque10@gmail.com Statistics specialist in Cluster Analysis using the K-Means algorithm with TensorFlow and SAP Hana to classify data with multiple variables.
Blog: https://quanticstats.blogspot.com/
Facebook: https://www.facebook.com/Qstats-387972448727379/
Twitter: https://twitter.com/statisticsq
This research is based on the publication "Seasonal Variation in the NDVI–Species Richness Relationship in a Prairie Grassland Experiment (Cedar Creek, Minnesota)" Link: https://www.mdpi.com/2072-4292/8/2/128/htm
Biodiversity indicators has a potential market with Governments, Universities and Not Government Organizations because of the Development of Sustainable Objectives defined by the United Nations. Copernicus Soil Water Index indicator could complement the NDVI indicator to measure water stress.
The study in Cedar Creek took the NDVI for a growing season from May to October 2014. Quoting the results "...DVI–species richness relationship through time and in relation to environmental variables and phenology. We show that NDVI, which is strongly associated with vegetation percent cover and biomass, is related to biodiversity for this prairie site, but it is also strongly influenced by other factors, including canopy growth stage, short-term water stress and shifting flowering patterns. ". Figure 1 shows NDVI plotted by species richness for the season from May to October 2014.
|
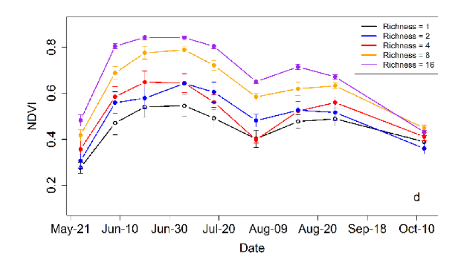
Important conclusions of the study are:
"...NDVI showed early-season increases in May and June, a period of canopy growth and development, as indicated by increases in plant height. By August 1, NDVI showed a deep decline accompanied by a coincident decline in surface soil moisture following a period of high temperatures and lack of precipitation but then recovered briefly during a subsequent period of lower temperature and high precipitation in mid to late August. After this second, smaller August rise, NDVI continued to decline gradually as plants senesced into the fall..."
The growing season for 2017-18 and 2018-19 was processed using the "R programming" API interface developed by Quantic Statistics to process NetCDF files from Copernicus satellite.
The results are in Figure 2:
|
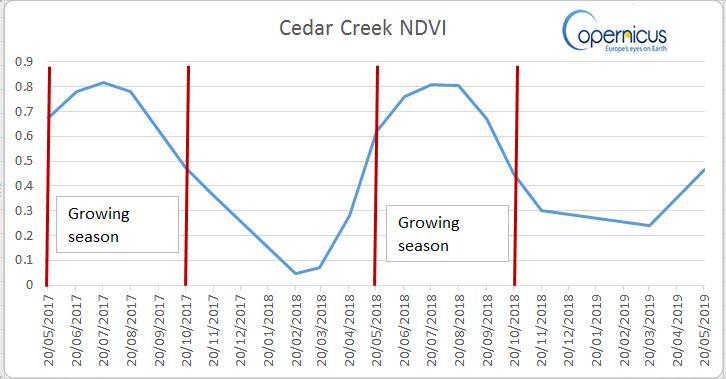
For both seasons, 2017 and 2018 no small recovery of in August NDVI is observed. It happened in August 2014.
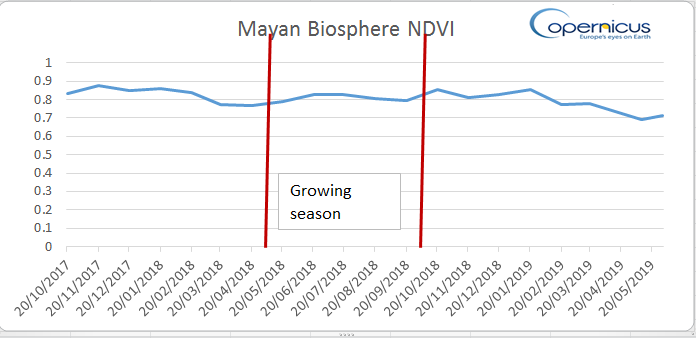
This study supports the NDVI research method to measure the vegetation percent cover and biomass, biodiversity, canopy growth stage, short-term water stress and shifting flowering patterns. The NDVI results in Figure 3 shows the vegetation performance in Mayan Biosphere in Guatemala for 2018.
|
|
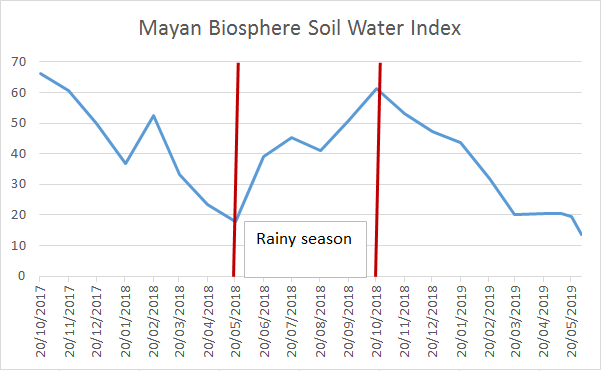
Figure 3 shows a steady and high NDVI between 0.8 and 0.9. Despite the very irregular Copernicus Soil Water Index indicator for the rainy season, figure 4. This demonstrates the high resistance of a biodiverse and protected region like Mayan Biosphere in front of water stress. This situation impacted at the beginning of the growing season in May 2019. The NDVI fell and also the rainy season have a one-month delay.
No comments:
Post a Comment